


Sales enablement metrics are the numbers that show whether enablement changes revenue, not just activity. The ones a revenue review accepts are ramp time to first full quota, coaching coverage per rep, and win rate by observed behavior. Completion rates and satisfaction scores support them but cannot stand alone. Report each one against a baseline, by team, every quarter.
Example. A Head of Sales Enablement brings three numbers to the quarterly business review: new reps reach first quota in fewer weeks, every rep had scored coaching sessions this quarter, and reps who handle the price objection well win more of their deals. Course completion goes in the appendix.
Reviewed and updated October 2026.
If you run sales enablement, your metrics get judged in a revenue review, not in an L&D report. A CRO wants three answers: how fast new reps ramp, how many reps were actually coached, and whether the behaviors you coached show up in won deals. This guide covers which sales enablement metrics to track, which to drop, and how to report them.
Sales enablement has a measurement gap of its own. Teams report what is easy to count, such as sessions delivered and courses completed, and leave out what the revenue side cares about. The five metrics below close that gap, from coaching coverage and skill application to ramp time, win rate by behavior and the return on the program.
What's in this post?
What are sales enablement metrics?
Sales enablement metrics measure whether enablement work (onboarding, coaching, content and tools) changes how reps sell and what they close. They are the sales branch of learning and development measurement, and they are judged by the same people who judge pipeline. These measurements play a crucial role in enabling companies to assess the results of their training program on employee performance, organizational strategy, and business impact. This results in an increase in the training effectiveness of any company's training program which contributes to the overall business success.
At their core, L&D measurements primarily serve the following four objectives:
Analyze an individual's training program's effectiveness.
Evaluate the success of the training.
Align learning to organizational objectives.
Analyze each training component's effectiveness individually.
However, gaining unbiased insights into the outcomes and effects of training interventions is the main goal of learning and development measurements.
Organizations can evaluate the success of their learning programs and spot opportunities for development by gathering both quantitative and qualitative data. Making educated decisions, improving training techniques, and ensuring that learning initiatives are aligned with organizational goals and all objectives are realistic to achieve with the use of the L&D measurements.

Why enablement metrics have to track to revenue
89% of L&D pros agree that proactively building employee skills will help navigate the evolving future of work.
Source: LinkedIn Learning, 2023 Workplace Learning Report.
Learning and Development measurements are important for a number of reasons, including the fact that they are key to creating effective training programs and evaluations and promoting organizational progress. If you are measuring a manager population specifically, our guide to leadership development sets out which capabilities are worth tracking in the first place.
Companies that provide development opportunities are generally regarded more favorably by employees who prioritize professional development. However, a common issue arises where training offered may not align with employees' actual learning needs to advance in their careers.
Consequently, this disconnect leads to decreased working engagement, and employees may view the training as an inconvenient interruption that offers no real benefits to their personal growth and development.
With that being said, here are a couple of key reasons why L&D measurements are important to ensure positive and productive growth and action:
Training evaluation: Organizations can accurately evaluate the efficacy of their learning programs by collecting and evaluating data on training completion rates, skill gain, and training satisfaction. By identifying areas of strength, weakness, and improvement, this evaluation assists in maximizing the impact of training initiatives.
Aligning with business objectives: To achieve intended business goals, everything - from course content to personalized training - must be created to build on the rep's capabilities. L&D measurements ensure that employee development aligns with the organization's strategic business objectives. By also selecting relevant KPIs that directly relate to desired outcomes, such as increased productivity or improved customer service, organizations can focus their training efforts on skills and competencies that contribute directly to achieving business goals.
Data-Driven decision-making: Organizations can learn a lot about the efficiency of their training initiatives by examining the interpreting the data that has been gathered. The ability to make data-driven decisions regarding resource allocation, training priorities, and alterations to learning methods gives L&D managers and business executives more control over their decisions.
Resource optimization: L&D measurements themselves cannot reveal business ROI. However, this metric can assist you to understand employee performance and assess how effectively that performance contributes to your organization's return on investment (ROI) when utilized to achieve its four primary goals. This is accomplished by assessing the success of the training. To put it another way: by determining the effect that training has on how well employees are performing.
Continuous improvement: Regularly tracking and analyzing L&D measurements foster a culture of continuous improvement. By identifying areas for enhancement and making data-driven adjustments to training content, organizations can continuously improve the effectiveness of their training programs. This iterative process keeps all training initiatives relevant and aligned with changing business needs.
Talent development and Employee engagement: Organizations can pinpoint possibilities for employee growth and development by tracking the effects of training on performance and skill acquisition. Employees that are more skilled and engaged are more likely to contribute to the accomplishment of the organizational goals and would stay committed to the organization in the long run.
The 5 sales enablement metrics to track
Enablement can be measured many ways. These five cover the whole chain, from whether reps were coached to whether the program paid back. Businesses can also create unique measures that take into account aspects unique to their industry or approach to training.
See how AI sales coaching works for your team.
Test AI coach in actionMetrics for measuring training effectiveness should be based on real-life data and make an honest effort to represent the results of L&D initiatives.
1. Completion rate and coaching coverage
For a sales team, completion only matters next to coverage: the share of reps who got scored practice and manager coaching in the period, not just the share who opened a module. The training completion rate is a metric that measures the percentage of employees who successfully complete their assigned training programs within a specific time frame. It can be calculated with the following formula:
Completion rate = Number of employees completed training ÷ Total number of employees enrolled) x 100
This measure assesses the engagement and commitment of employees toward their learning initiatives. A high completion rate indicates that employees are actively participating in training, which is essential for knowledge and skill acquisition. On the other hand, a low completion rate may suggest potential issues with the training program or training content, delivery methods, or employee motivation.
However, having a high completion rate does not guarantee that your team is receiving quality training. To get a whole view of how your employees are doing, scores, staff feedback, and completion rates must be evaluated holistically.
To avoid this, be careful to communicate with your employees often while you conduct your L&D program. Regular check-ins are what will do the job for you. In any case, it is crucial to stay on schedule by getting employee input and keeping track of completions.
2. Skill acquisition and application
This measure evaluates the extent to which employees acquire new skills through training and their own ability to apply these skills effectively in their job roles and daily tasks.
Skill acquisition is typically assessed through pre and post-training assessments or performance evaluations. It can also be calculated with the assessment pass rate formula:
Assessment Pass Rate = (Number of employees that pass a training ÷ Total number of employees that participated) x 100
A significant increase in employees' performance or competency levels after training indicates that a successful skill acquisition has resulted from the training program. However, skill application is equally crucial. Tracking how employees utilize their new knowledge in real-life scenarios demonstrates the practical impact of training on job performance. For example, do they respond better to customers?
3. Impact on performance: ramp time and win rate by behavior
This is the metric a revenue review reads first. For sales teams it comes down to two numbers: ramp time, measured in weeks from start date to first full quota, and win rate split by the behaviors you coached, for example deals where the rep handled the price objection well against deals where they did not. Retorio's enterprise customer studies document a 38% to 42% reduction in ramp time. The training impact on performance measure analyzes the correlation between training initiatives and improvements in job performance or productivity. This metric focuses on measuring the tangible benefits of training in terms of actual job outcomes. It can be evaluated through performance metrics, productivity indicators, customer satisfaction ratings, or other relevant key performance indicators. If the appraisal cycle is where you capture this, the steps in the performance appraisal process show where the before and after readings belong.
A positive impact on performance indicates that training efforts are directly contributing to the organization's success.
4. Rep feedback and satisfaction
Understanding the success of training programs depends on getting input from employees about their learning experiences.
Employee Feedback and Satisfaction measures how satisfied participants are overall with the training's subject matter, methods of instruction, and learning environment.L&D managers may gather information, pinpoint strengths and flaws, and make data-driven modifications to improve future training programs by conducting post-training surveys or focus groups. For deeper context, see Coaching High-Stakes Conversations: A 5-Step Framework.
This can be measured with the following formula:
Customer Satisfaction Rating = Number of positive customer responses ÷ Total number of customer responses
5. Sales training ROI
An important metric for evaluating the financial return on investment for learning and development programs is the ROI of Training.
It entails weighing the expense of training against the advantages brought forth by enhanced performance, higher output, decreased turnover, or other quantifiable results.
The allocation of resources to employee development initiatives is justified by a good ROI, which shows that the organization's investment in learning and development is producing real results.
This can be calculated with the following formula:
Training ROI = Change in profit made as a result of training ÷ Total cost of training

What to drop, and how to report it to a revenue review
Most enablement dashboards carry numbers nobody in a revenue review acts on. Move these to an appendix:
Hours of content consumed. It measures time spent, not change in how reps sell.
Course completion on its own. Keep it as a coverage check, never as the headline.
Satisfaction scores with no link to behavior. Reps liking a session does not move win rate.
Report the rest on one page, per team, against a baseline:
Ramp time. Weeks to first full quota for this quarter's new hires, against the previous cohort.
Coaching coverage. The share of reps with scored practice and manager coaching in the period.
Win rate by behavior. Win rate on deals where the coached behavior was observed, against deals where it was not.
Return. The change in revenue or quota attainment, set against the full cost of the program including time out of the field.
Lead with the trend, name the behavior behind it, and say what you will coach next quarter. That is the format a CRO reads.
What is the Kirkpatrick model?
The Kirkpatrick Model is a widely used technique for assessing the success of training and education initiatives. It evaluates training techniques, both official and informal, and ranks them according to four levels of standards: reaction, learning, behavior, and impact. Some organizations also include ROI as an additional 5th level.
Below is an explanation of each level of the Kirkpatrick model
| Level 1: Reaction - How did reps respond to the training? | L&D supervisors evaluate how trainees are responding to the training program. This level focuses on gathering participant feedback regarding their training experience, including their views of the program's content, methods of delivery, and facilitators, as well as their opinions and levels of satisfaction. Typically, surveys, questionnaires, or focus group discussions are used to collect feedback. |
| Level 2: Learning - What knowledge and skills did the reps acquire? | Level 2 assesses how much training-related information and skills were learned by participants. To quantify learning gains and improvements in certain abilities, this evaluation frequently entails performing pre- and post-training evaluations. |
| Level 3: Behavior - Did reps apply what they learned on the job? | This is where measuring the application of learning in the workplace comes into focus. Managers of L&D evaluate participants' use of newly learned information and skills about their employment duties. This assessment often includes observation, performance reviews, and input from peers or superiors. |
| Level 4: Results - What is the impact of the training on business outcomes? | This level assesses how the training has affected the organization's performance and financial health more broadly. Key performance indicators (KPIs) for company objectives like better productivity, lower costs, more customer happiness, or higher staff retention rates are examined by L&D managers. |
| Level 5: Return on Investment - What is the financial return on the training investment? | This level evaluates the investment in training's financial return. Calculating the financial gains from the training, such as increased revenue or cost savings, and contrasting them with the overall cost of putting the training program into place is also necessary. When making decisions about future investments in employee development, L&D managers may use the ROI calculation to strengthen their case to organizational stakeholders for the value of training efforts. |
Below is an infographic that summarizes the 5 levels of L&D metrics that will help your company effortlessly boost your training success:
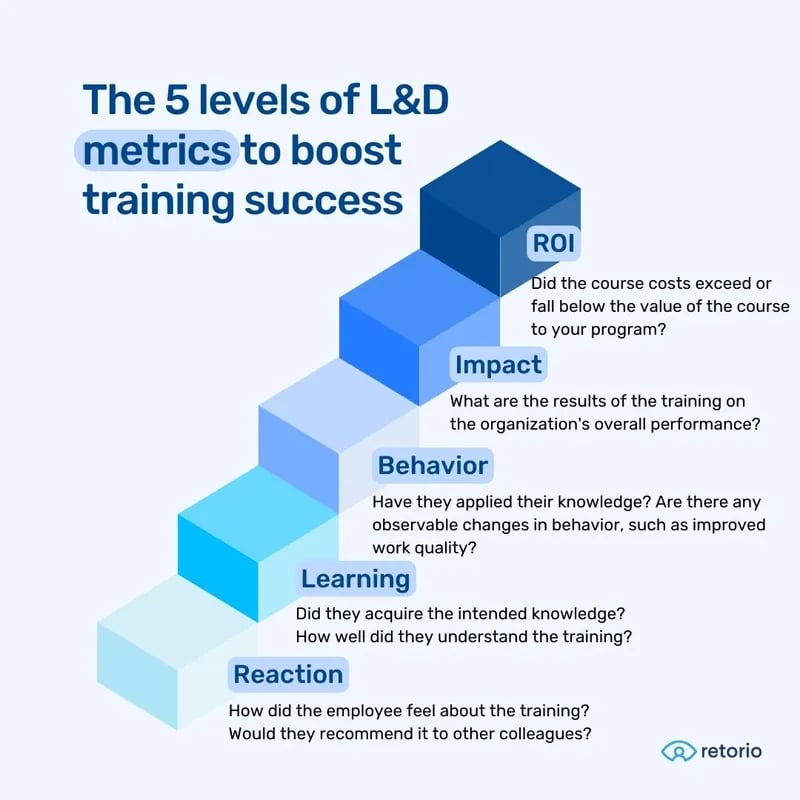
The five levels of L&D measurement, from reaction through to return on investment.
What it takes to make an enterprise coaching program measurable and scalable, not just delivered. Source: Retorio.
Retorio makes the behavior behind these metrics measurable. Retorio's platform delivers AI-based coaching with personalized feedback to every rep. Each rep sees their own results, and managers see cohort-level results (default minimum of seven users).
This lets enablement leaders see at cohort level where coaching is needed and focus their programs there. For the wider picture, see how AI-driven employee development works once the measurement loop is running.
Try it on one of your own sales scenarios below.
See what a measurable coaching program looks like
Run one scenario and get behavioral feedback on it.
Test AI coach in action
FAQ
What are sales enablement metrics?
Sales enablement metrics measure whether enablement work changes how reps sell and what they close. The core set is ramp time to first full quota, coaching coverage per rep, win rate by observed behavior, and the return on the program cost. Activity numbers such as completion rates support them but should not lead the report.
Which sales enablement metrics does a revenue review accept?
The ones tied to revenue: how fast new reps reach quota, how many reps were actually coached in the period, and whether deals where the coached behavior showed up close more often than deals where it did not. Report each one against a baseline and by team.
How do you calculate sales training ROI?
Divide the change in profit that results from the program by its total cost, including rep and manager time out of the field. Use a comparison group or a before and after baseline, so the change you report is not just seasonality.
Which enablement metrics should you stop reporting?
Hours of content consumed, course completion on its own, and satisfaction scores with no link to behavior. Keep them as diagnostics in an appendix. They show activity, not whether reps sell differently.
Written with help from LLMs, edited and checked by Önder Mutluer, Website Manager and Marketing Strategist, and Dr. Patrick Oehler, Co-founder and Co-CEO. How this article was researched, written and checked, and who reviews which topic: Retorio editorial policy.