

Until now, Retorio Analytics focused on one team member at a time. With this release, admins can zoom out to the entire organization, or compare cohorts side by side, in the dashboard they already use.
Consistent, high-quality coaching is hard to see at scale. As teams grow, leaders lose the line of sight between the coaching their people do every day and the business outcomes it drives. Organization and Cohort Analytics closes that gap by turning thousands of individual coaching moments into one clear, always-current view.
See how a whole organization is performing
Engagement and coaching performance across an entire team in one place, updated as reps complete their coaching. Admins get activity over time, completed scenarios, and Warmth & Competence development at organization level, so they can tell at a glance where momentum is building and where it is not.
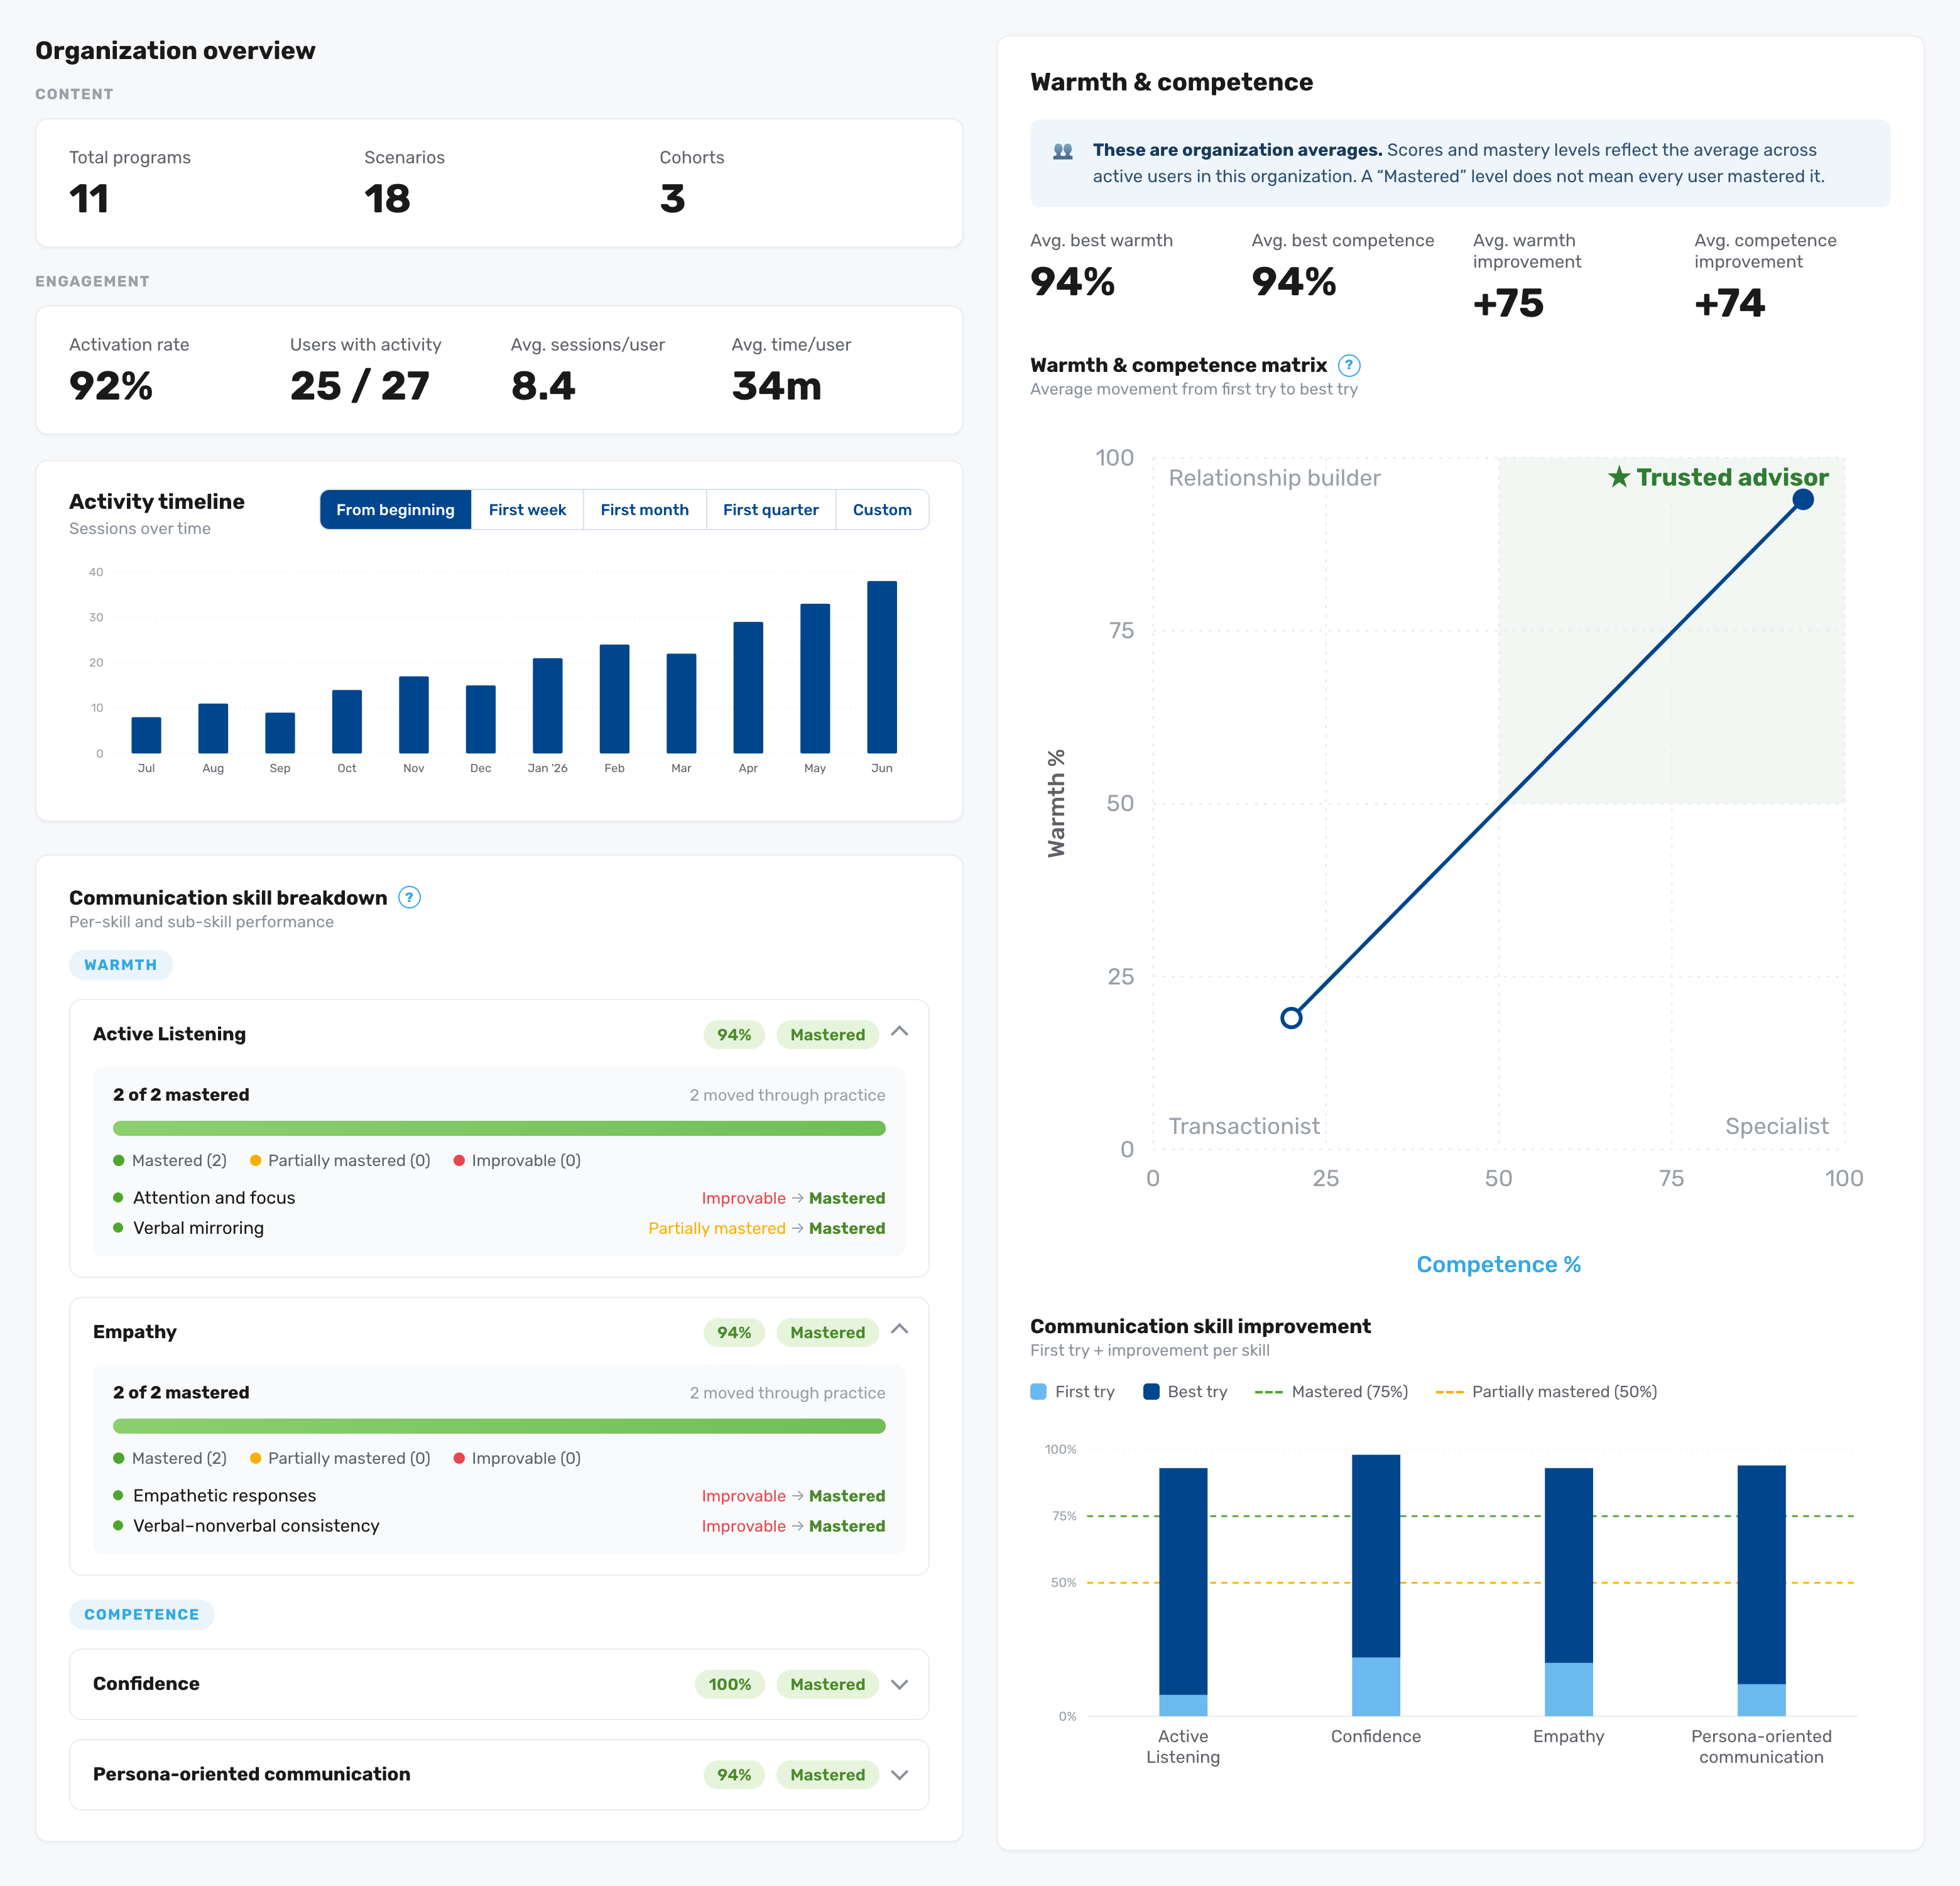
The Organization Analytics dashboard rolls every rep’s activity into one org-wide view: adoption, completed scenarios, and Warmth & Competence trends. Example: a Head of Enablement sees org-wide momentum first, then drops into cohort comparison to find out which groups are driving it.
Compare cohorts side by side
It shows which cohorts are most active, where coaching is landing, and where a nudge would help. Comparing cohorts directly means the right teams get support at the right time, instead of every group being treated the same.
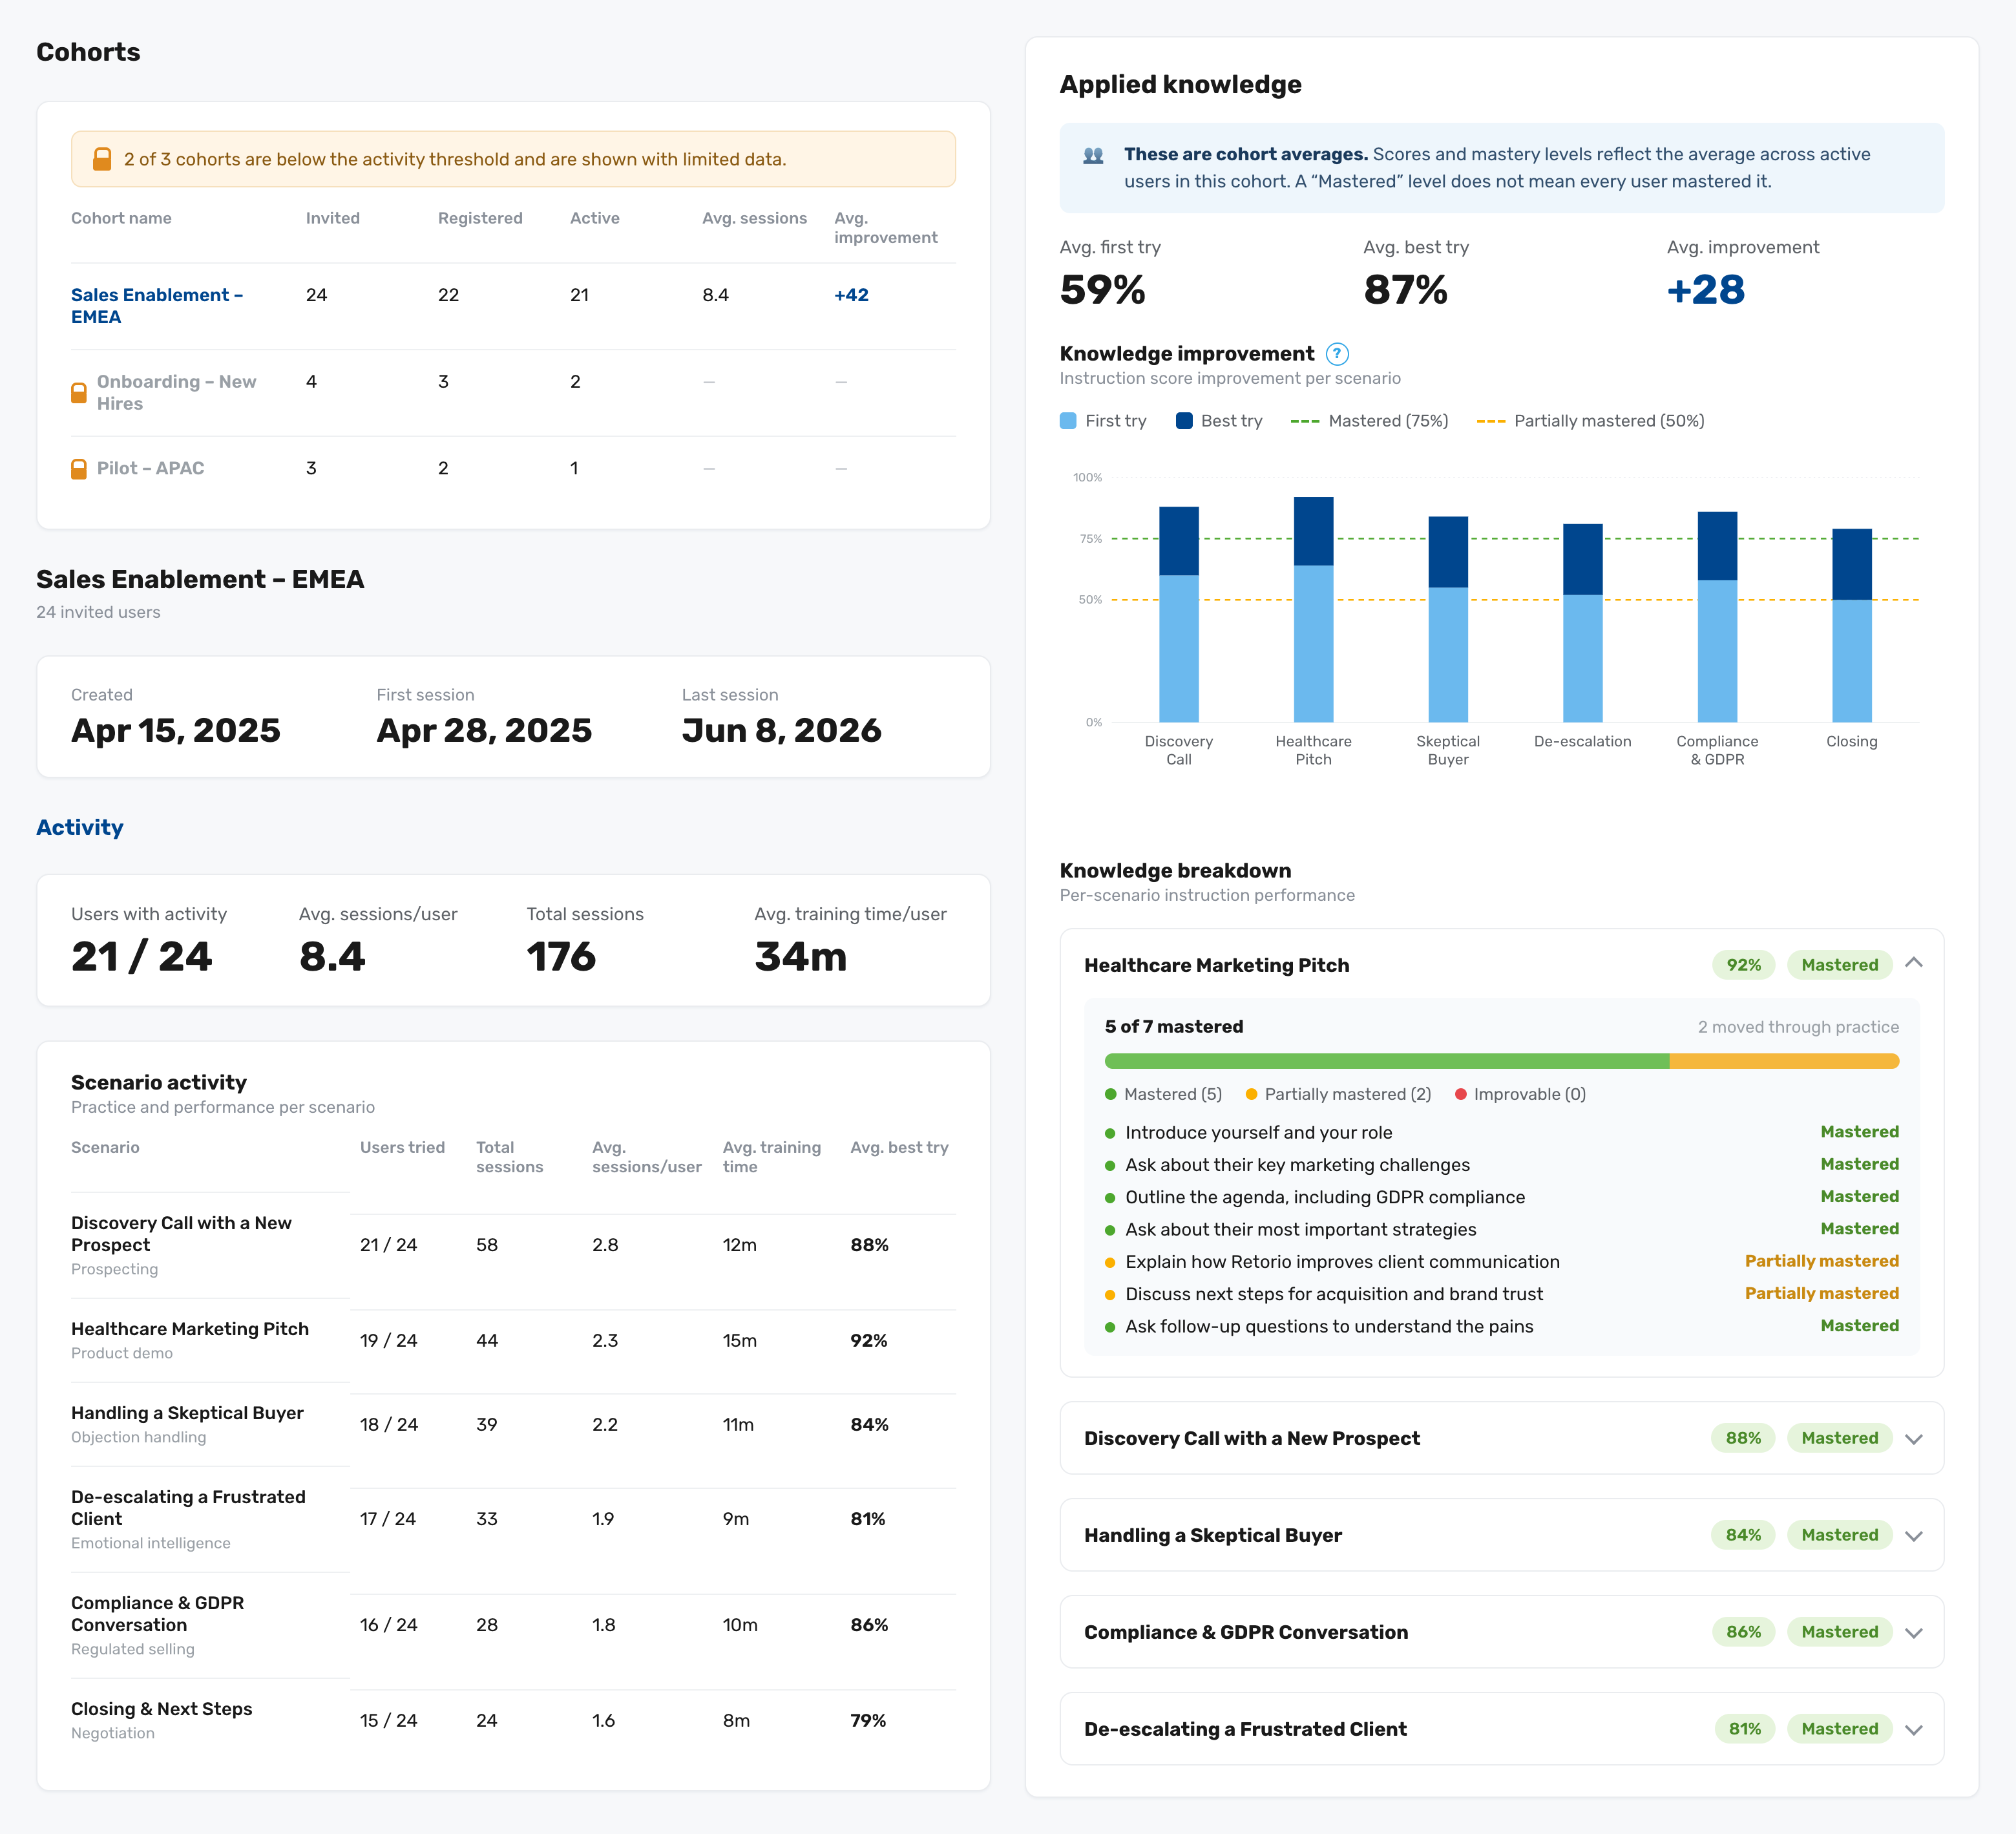
Cohort Analytics puts groups side by side, so you compare instead of guess (small cohorts stay hidden behind privacy thresholds). Example: the Q1 new-hire cohort reaches call-ready confidence faster than the Q4 cohort, so you double down on what worked.
Availability
Organization and Cohort Analytics is live now for Retorio customers. Admins find it in the Analytics section of the dashboard, next to the individual view, with no configuration required.
See Retorio in action
Organization and Cohort Analytics is available today for Retorio customers. To see how AI coaching and behavioral analytics could work for your team, book a demo.